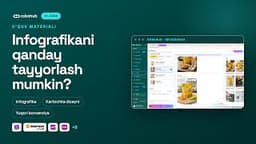






Visualize marketplace data with the Infographics feature in the Learning materials section.
What is it?
Infographics is a feature in the Learning materials section: marketplace data and sales metrics are shown visually instead of in tables.
Why does it matter?
Charts and visuals help you understand numbers faster — trends and changes are visible at a glance.
In the video
- Go to the Learning materials section
- Get to know Infographics
- Visualize marketplace data
- Understand your sales metrics
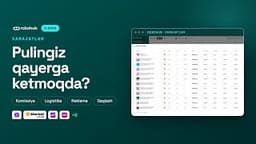
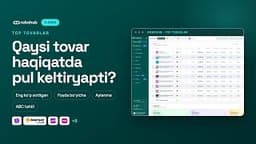 +5
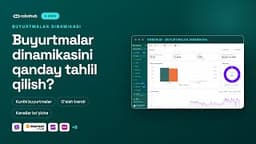
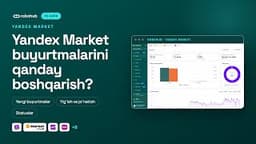
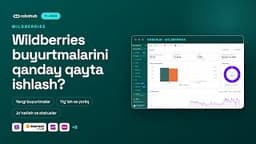 +3






 +1